Charts
OpenSheets includes a built-in charting engine that renders directly on an HTML5 canvas. Charts are created from data ranges and displayed as draggable, floating overlays on top of the spreadsheet grid.
Supported Chart Types
| Type | Description |
|---|---|
| Bar / Column | Vertical bars grouped by series. Useful for comparing categories side by side. |
| Line | Data points connected by lines with dot markers. Ideal for trends over time. |
| Area | Same as line but with a filled region beneath each series. |
| Pie | Circular chart showing proportions of the first data series. Percentage labels appear on each slice. |
| Doughnut | Like pie, but with a hollow center (55% inner radius). |
| Scatter | Individual data points plotted without connecting lines. |
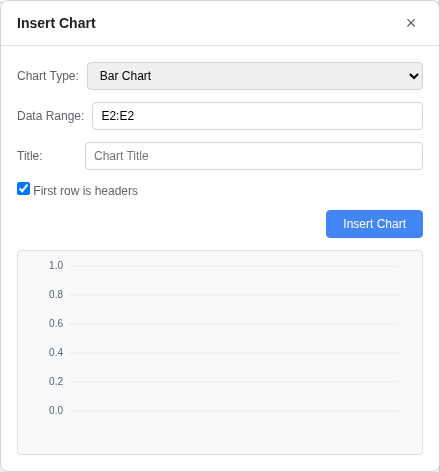
Creating a Chart
- Select the data range you want to chart (including headers).
- Open the chart dialog via Insert > Chart in the menu bar.
- The selected range is auto-filled into the Data Range field (e.g.
A1:D10). - Choose a Chart Type from the dropdown.
- Optionally enter a Chart Title.
- Check First row is headers if your first row contains series names.
- A live preview renders in the dialog as you change settings.
- Click Insert Chart to place the chart on the sheet.
Data Layout
- The first column of the range is used as category labels (X-axis or pie slice names).
- Each subsequent column becomes a separate data series.
- If "First row is headers" is checked, the header values become series names shown in the legend.
- For a single-column range, all values are treated as one series.
Interacting with Charts
- Move: Drag the chart header bar to reposition it anywhere on the sheet.
- Delete: Click the X button on the chart header.
- Auto-update: Charts automatically re-render when the underlying cell data changes (on edit, undo, or redo).
Multi-Series Support
When plotting multiple series, each series is assigned a distinct color from the built-in palette. A legend is displayed at the bottom of the chart when more than one series is present.
Serialization
Chart definitions (type, title, range, position, and dimensions) are saved and restored as part of the workbook. When sharing via URL or saving to Supabase, chart configurations are preserved.