Dashboard Builder
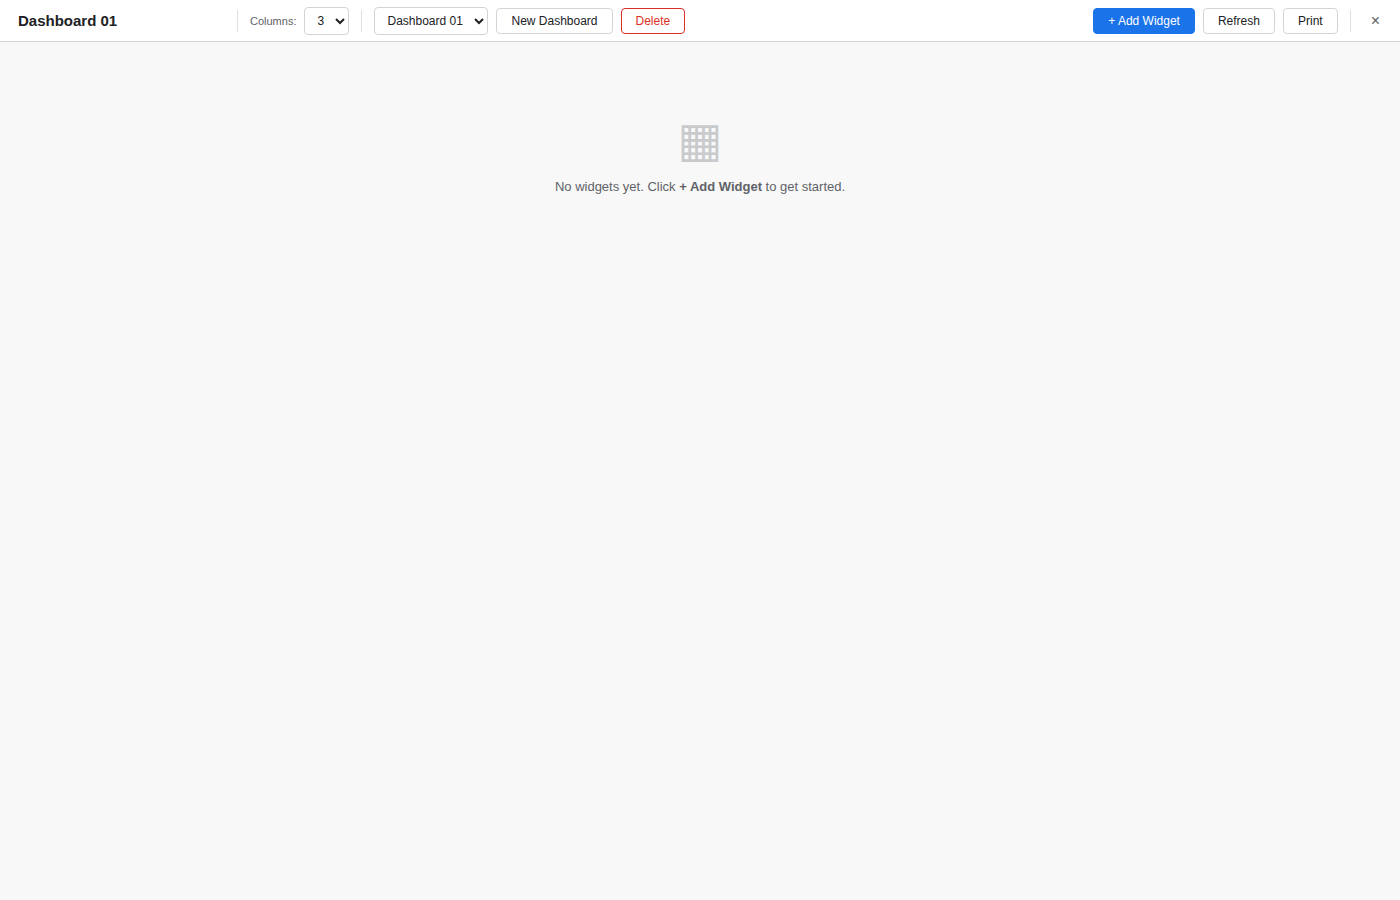
The Dashboard Builder creates interactive dashboards composed of widgets that visualize your spreadsheet data. Dashboards open as a full-screen overlay on top of the spreadsheet.
Opening the Dashboard Builder
Open via View > Dashboard Builder in the menu bar.
Creating a Dashboard
- Click New Dashboard in the top bar.
- Enter a name for the dashboard (editable in the title field at any time).
- Add widgets using the + Add Widget button.
Widget Types
| Type | Description |
|---|---|
| Stat Card | Displays a single numeric value from a cell, with optional currency or percent formatting. |
| Data Table | Shows a range of cells as a formatted table. |
| Chart | Renders a bar, line, pie, or doughnut chart from a data range. |
| Query Result | Displays the results of a saved SQL query from the Query Builder. |
| Text / Note | A free-text widget for labels, descriptions, or notes. |
Configuring Widgets
Each widget has a configuration panel accessed via the gear icon on its header:
- Title: Display name shown in the widget header.
- Data source: Cell reference or range (e.g.
A1for stat cards,A1:D10for tables/charts). - Stat format: Number, Currency ($), or Percent (%) for stat cards.
- Chart type: Bar, Line, Pie, or Doughnut for chart widgets.
- Auto-refresh: Set an interval (manual, 10s, 30s, or 60s) for automatic data refresh.
Layout
Widgets are arranged in a responsive CSS grid. The default layout uses 3 columns. Widgets can be:
- Reordered by dragging the header to swap positions with other widgets.
- Deleted using the X button on the widget header.
Multiple Dashboards
Create and switch between multiple dashboards using the dashboard selector dropdown in the top bar. Each dashboard maintains its own set of widgets independently.
Serialization
Dashboard definitions (widget configurations, layout, and dashboard metadata) are saved as part of the workbook and restored on load.